of course, this Macro can be improved...
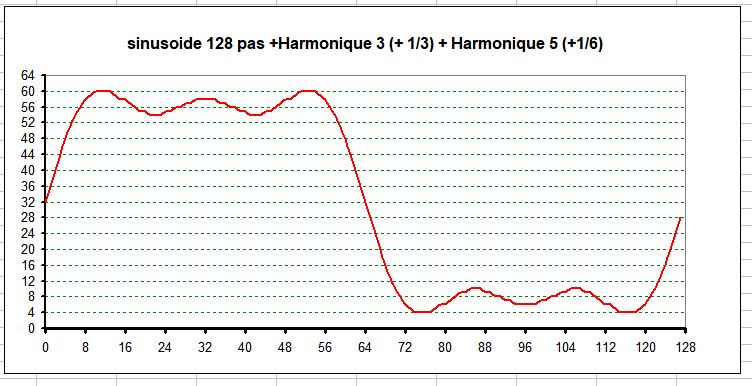
Amplitude for a OLED 128x64
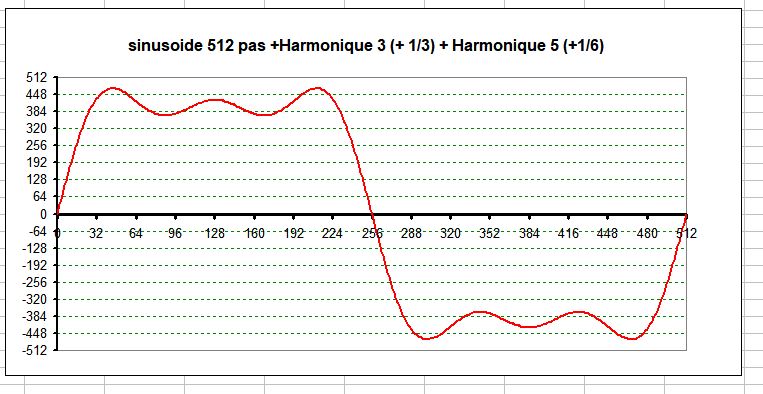
2nd example , with 512 data
Excel file : Signal_generation_Sinus_harmoniq_2021.xls
How to use it :
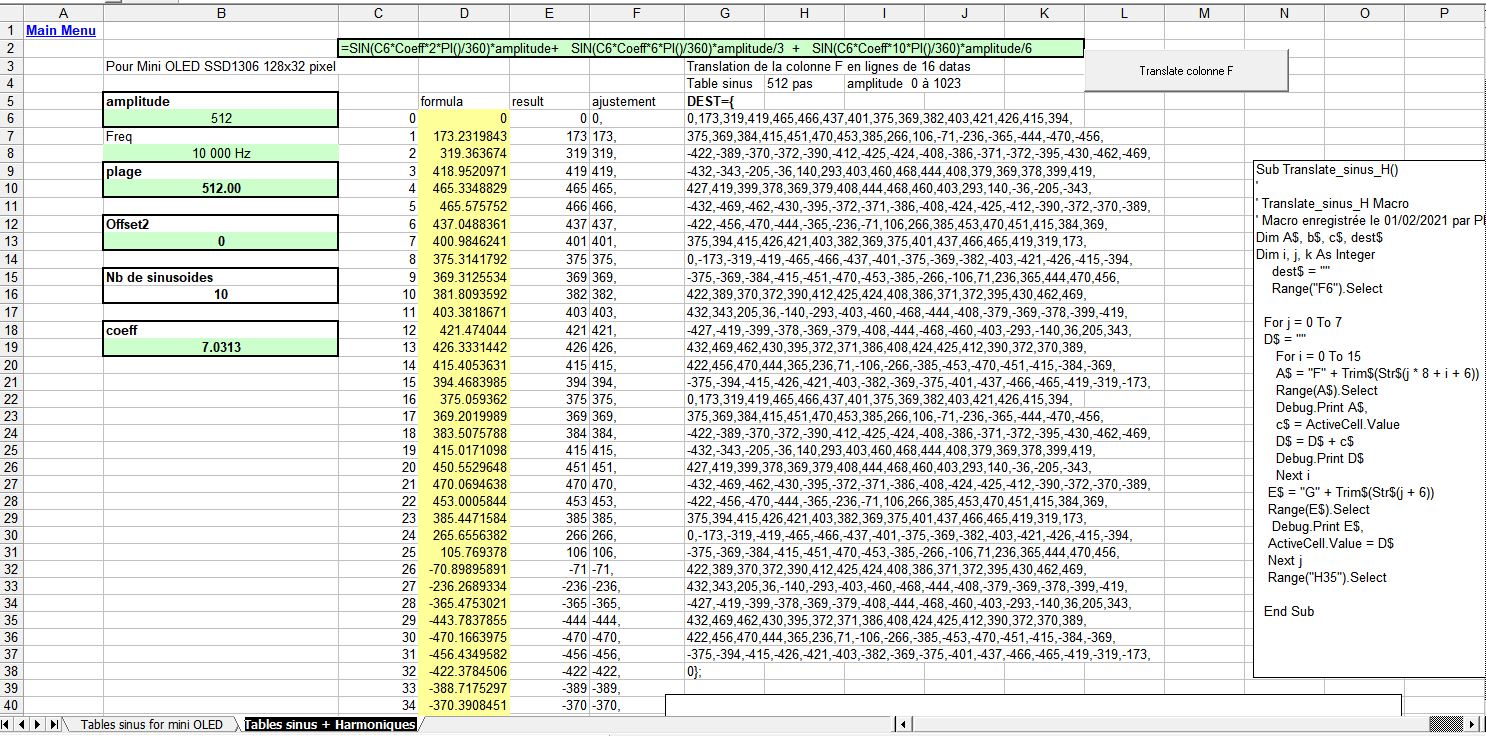
open "Tables sinus + Harmonique"
into the cell D6
you can modify the formula according the signal shape do you want ..
a pure sinuoside formula is only the 1rst parameter ie: =SIN(C6*Coeff*2*PI()/360)*amplitude
2nd parameter add harmonique 3 => 3* 2*PI = 6*PI with amplitude divided by 3
3nd parameter add harmonique 5 => 5* 2*PI = 10*PI with amplitude divided by6
then copy the formula in all others cells ( D7 to the last =D(7+size of table) => last cell D518
the collum "adjustment" automaticly round all values to get integer ( no decimales) and add a comma separator ","
click on button "Translate colonne F"
takes all data in collum F , and copy in horizontal rows , modulo 16 values
to build a table , with name DEST[}={
Manually, correct the last value of this table : replace "," by "};" to close the table
then you can select the (table) zone G5:G38
and copy/past into MikroC source...
Image
"plage" is the size of table (number of data to build the signal)
"coeff" in the example is 360/plage .. to get exactly one signal only (360°)
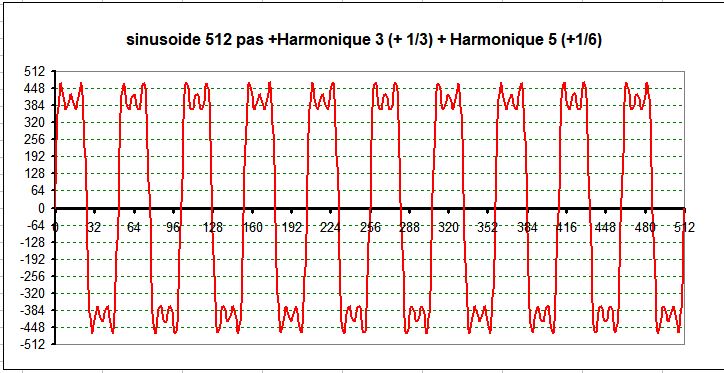
Another example :
if you use coeff= 3600/Plage => cell B12=0.70313
you get 10 times the basis sample
if you use an offset of 512 , all values will be in the range 0 to 1023, instead of +512 -512
Result :
DEST={
0,173,319,419,465,466,437,401,375,369,382,403,421,426,415,394,
375,369,384,415,451,470,453,385,266,106,-71,-236,-365,-444,-470,-456,
-422,-389,-370,-372,-390,-412,-425,-424,-408,-386,-371,-372,-395,-430,-462,-469,
-432,-343,-205,-36,140,293,403,460,468,444,408,379,369,378,399,419,
427,419,399,378,369,379,408,444,468,460,403,293,140,-36,-205,-343,
-432,-469,-462,-430,-395,-372,-371,-386,-408,-424,-425,-412,-390,-372,-370,-389,
-422,-456,-470,-444,-365,-236,-71,106,266,385,453,470,451,415,384,369,
375,394,415,426,421,403,382,369,375,401,437,466,465,419,319,173,
0,-173,-319,-419,-465,-466,-437,-401,-375,-369,-382,-403,-421,-426,-415,-394,
-375,-369,-384,-415,-451,-470,-453,-385,-266,-106,71,236,365,444,470,456,
422,389,370,372,390,412,425,424,408,386,371,372,395,430,462,469,
432,343,205,36,-140,-293,-403,-460,-468,-444,-408,-379,-369,-378,-399,-419,
-427,-419,-399,-378,-369,-379,-408,-444,-468,-460,-403,-293,-140,36,205,343,
432,469,462,430,395,372,371,386,408,424,425,412,390,372,370,389,
422,456,470,444,365,236,71,-106,-266,-385,-453,-470,-451,-415,-384,-369,
-375,-394,-415,-426,-421,-403,-382,-369,-375,-401,-437,-466,-465,-419,-319,-173,
0};
The MCU can also build by itself the desired signal table ..
but with excel you have a preview of the final signal ...
and MCU don't have all Trigonometrics Formula as in excel !
Many other application can buid also shapes of signal ..
gnuplot (wgnuplot.exe)
..etc ..
Retour à l'index general